モバイルでのパフォーマンスを測ってみた:古い iPhone と Android の普及機で PLATEAU を回す
2018 年の iPhone XS と普及帯の Android タブレットで、PLATEAU の千代田区を MapLibre・Cesium・Navara・ortho-earth の最新版で測りました。Navara はどの計り方でも崩れず、普及機でも 60 fps で回せるエンジンが複数ありました。
This is the project for all people on the earth. The earth is round.
A 3D globe with no install, no account and no server. Share the GIS data you made with everyone on Earth.
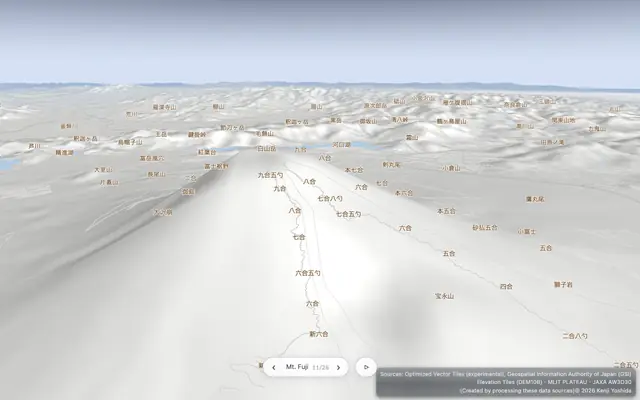 A demo that draws everything with one camera — from Japan's city data (PLATEAU) to the Solar System, from flat maps to 3D maps.Equal Earth26 languages
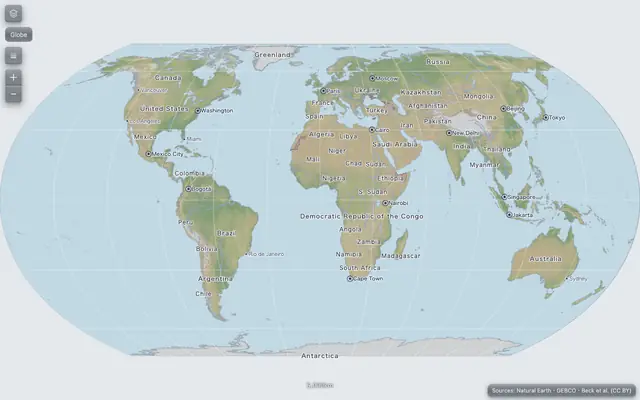 A scrolling Equal Earth world map with choropleths. Right-click any point to turn it into a 3D globe centered there.World quiz26 languages
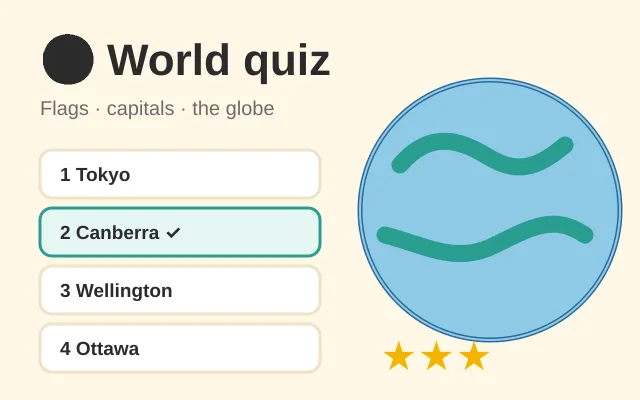 A geography quiz for kids and grown-ups: flags, capitals and where countries are on the 3D globe. Three levels, the whole world or one region, stars and badges — and the countries you miss come back until you know them.geoedit26 languages
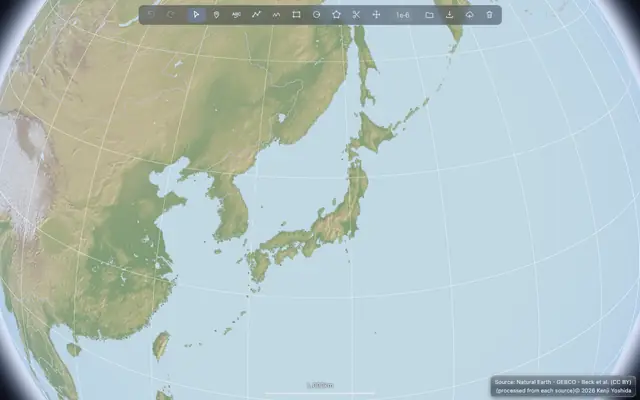 A map editor. Draw and fix shapes on the 3D globe, and save them as GIS data.Nations of the World26 languages
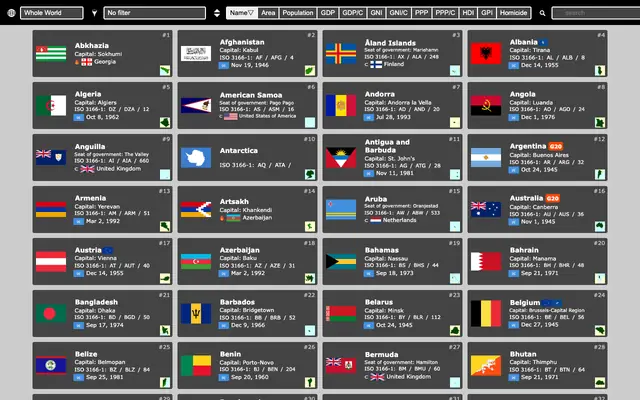 Basic data for the countries and territories of the world, as cards — facts, flag and anthem, Wikipedia and map.Landforms of the World26 languages
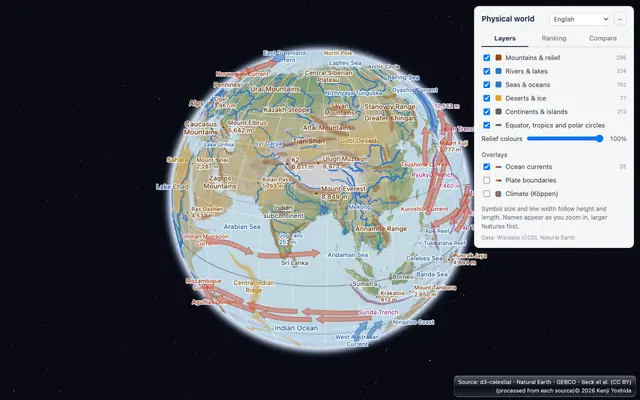 Mountains, rivers, lakes, seas and deserts of the world on a 3D globe — rank them, compare their heights and lengths, and overlay ocean currents, plate boundaries and climate zones.National Parks of the United States26 languages
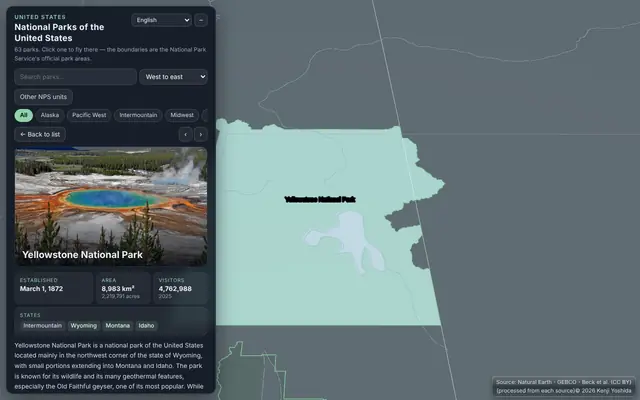 All 63 national parks of the United States on a 3D globe — photos, the National Park Service's boundaries, facts and Wikipedia links.World clock26 languages
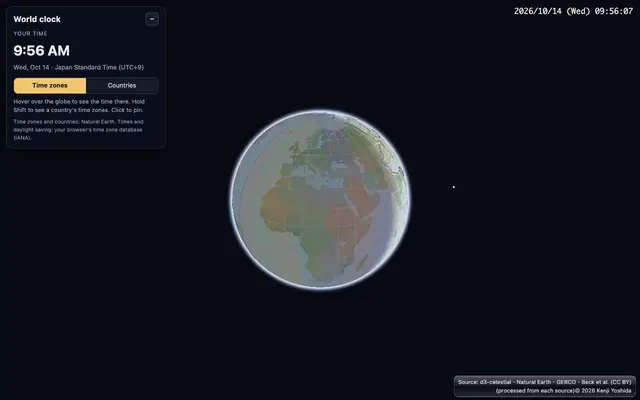 What time is it there? The local time of every time zone on a 3D globe, with daylight saving time and the night side — hover a place, or hold Shift for a whole country.World population in hexagons26 languages
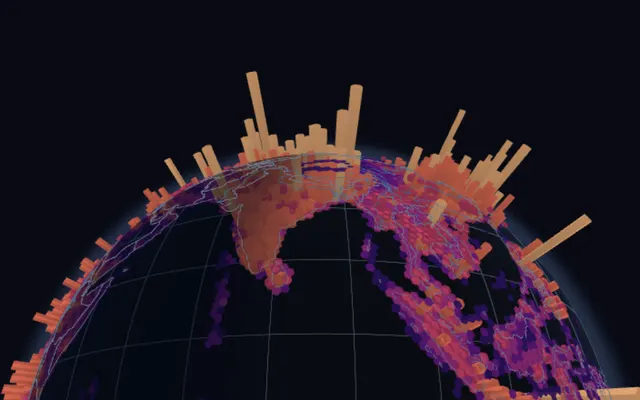 Where the world's 8 billion people live, as hexagonal columns on a 3D globe (H3 cells, Kontur Population). Zoom in for finer hexagons, drop your own points to count them.The shortest way is an arc26 languages
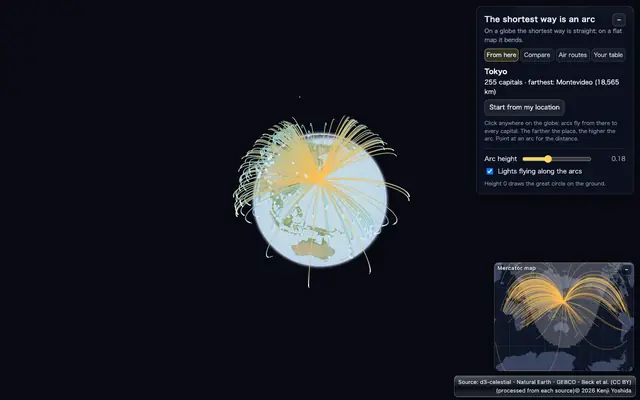 On a globe the shortest way between two places is a great circle. Arcs from anywhere to every capital, 37,000 air routes, great circle vs rhumb line, and your own CSV.World earthquakes26 languages
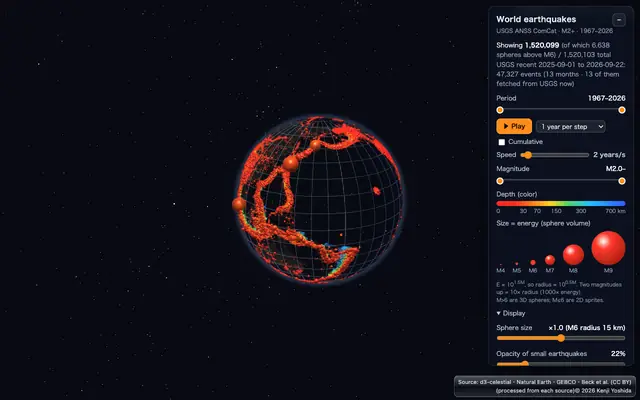 Reads USGS earthquake data directly and shows each quake in 3D by its energy and depth. It can also play year by year or month by month.Satellites26 languages
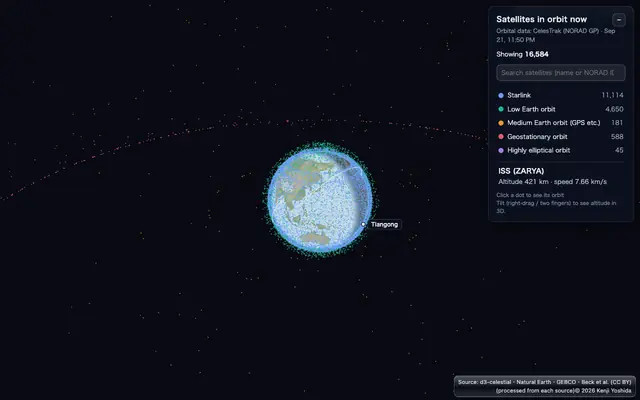 The current positions of satellites from CelesTrak data. Click a satellite to draw its orbit in 3D.Clouds now26 languages
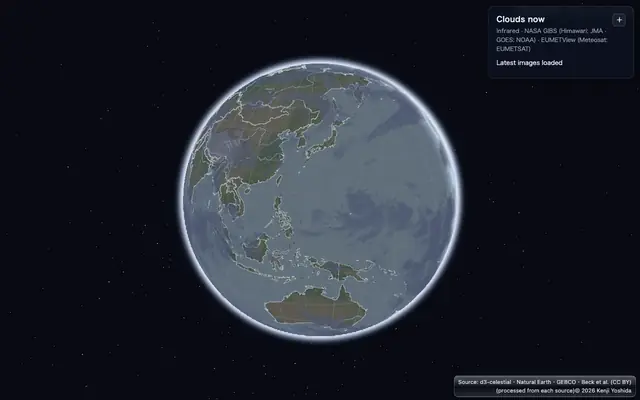 Infrared images from five geostationary weather satellites (Himawari, GOES, Meteosat), read straight from NASA GIBS and EUMETSAT and drawn in 3D over the globe.ortho-solar26 languages
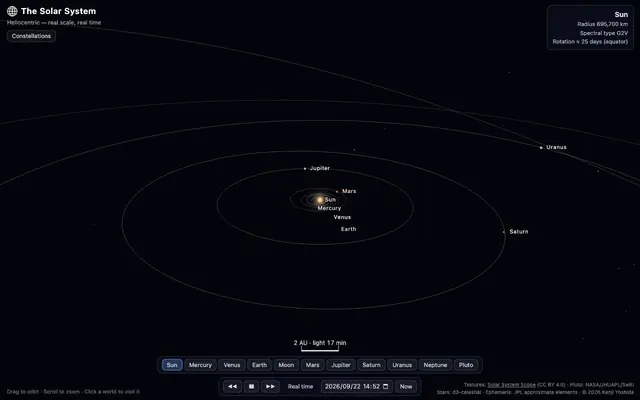 The current positions of the planets and their moons — and a replay of how they move over time.Daily calendar26 languages
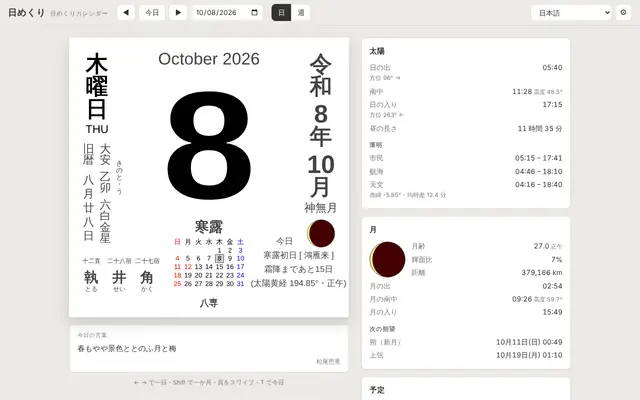 A Japanese tear-off calendar (lunisolar date, rokuyō, solar terms, holidays) with sunrise, sunset, twilight and the Moon for where you stand, computed with your elevation. Scroll a week without end; add your own iCal.Make a video26 languages
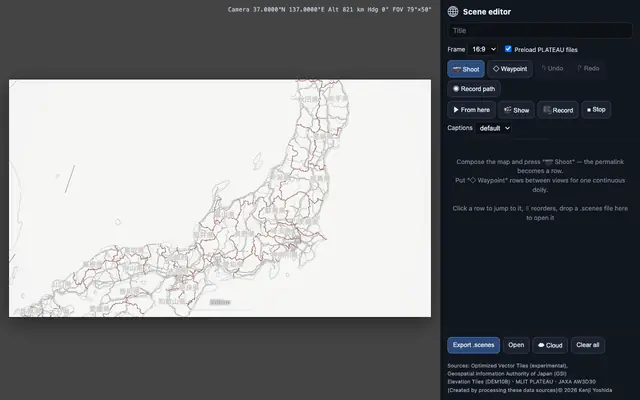 Cut out scenes of the 3D map and save or play them as one continuous video.GeoPBF26 languages
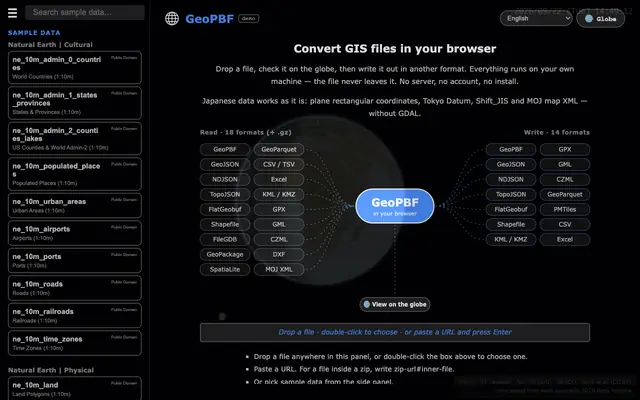 Drop a GIS file, check it on the globe, write it in another format — 18 formats in, 14 out. The file never leaves your machine.MapLibre examplesEnglish only
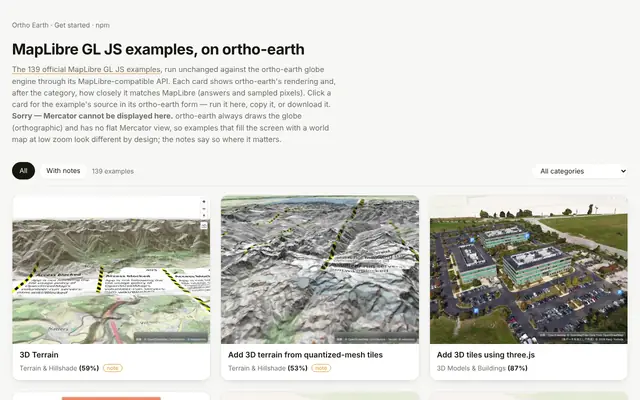 All 139 official MapLibre GL JS examples, run unchanged on the ortho-earth globe. Each card shows how closely it matches MapLibre; press Run to try it, or copy the code.SandcastleEnglish only
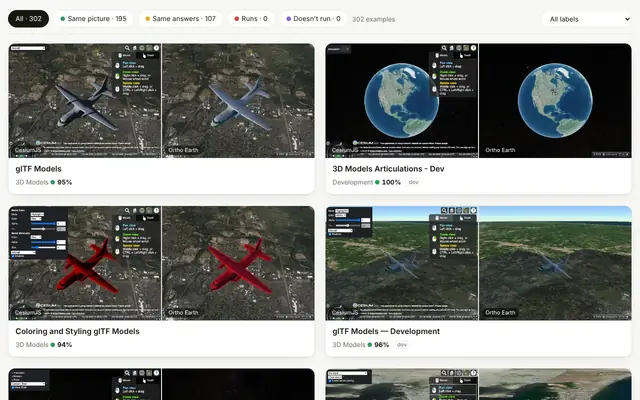 The official CesiumJS Sandcastle examples, run unchanged on the Ortho Earth globe through its Cesium-compatible facade. Each card puts CesiumJS and Ortho Earth side by side, with how closely the pictures match.Japan's open GIS dataJapanese only
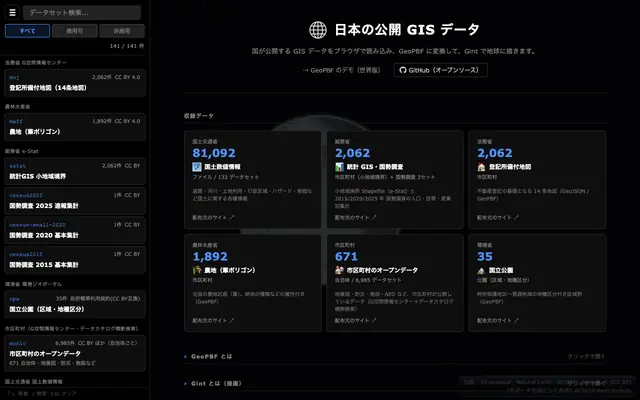 View and convert the open GIS data published in Japan.census2020Japanese only
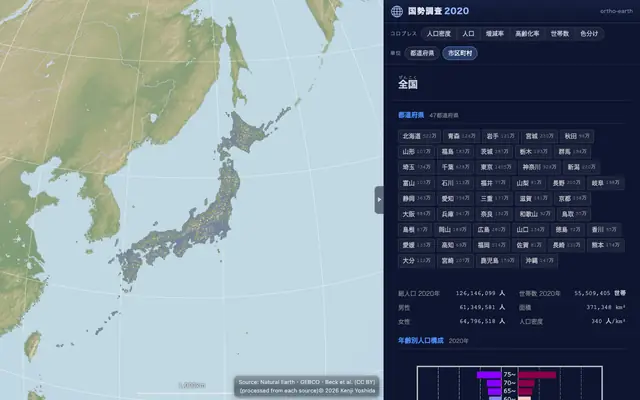 Drill down into Japan's 2020 census — small-area statistics, disaster risk zones and land parcels.Yokohama digital twin26 languages
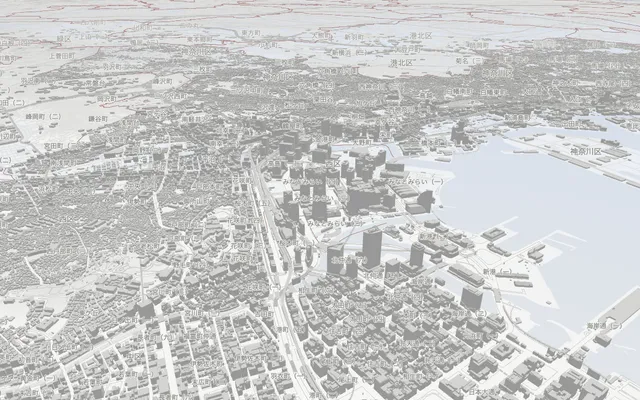 A citizen-first digital twin of Yokohama: tap your home to see your school districts, nearest stations, flood risk and nearest evacuation site on one card. Walking distance from stations, facility search and hazard maps over PLATEAU 3D buildings, in 26 languages.Kyoto digital twin26 languages
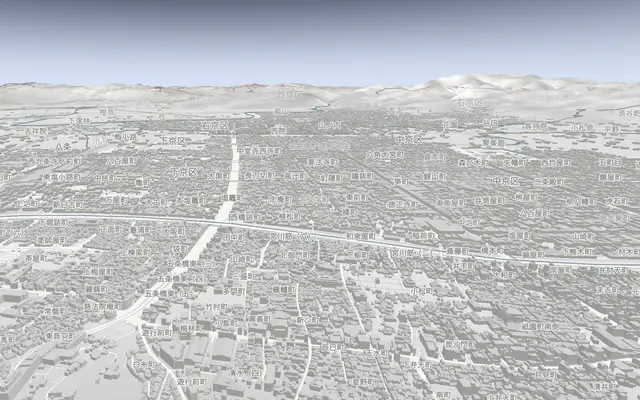 A citizen-first digital twin of Kyoto on the same core as Yokohama: tap your home for nearest stations, flood and landslide risk and evacuation sites on one card. Temples, a history tour from 794 and PLATEAU 3D buildings, in 26 languages.Fukuoka digital twin26 languages
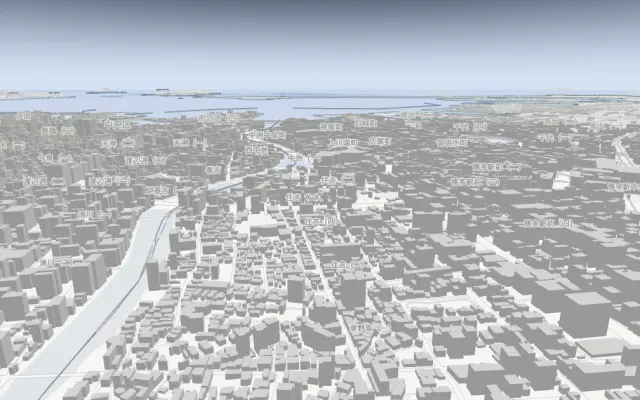 A citizen-first digital twin of Fukuoka on the same core as Yokohama and Kyoto: tap your home for nearest stations, flood, storm-surge and tsunami risk and evacuation sites on one card. Hakata and Tenjin, a history tour from 57 AD and PLATEAU 3D buildings, in 26 languages.Sapporo digital twin26 languages
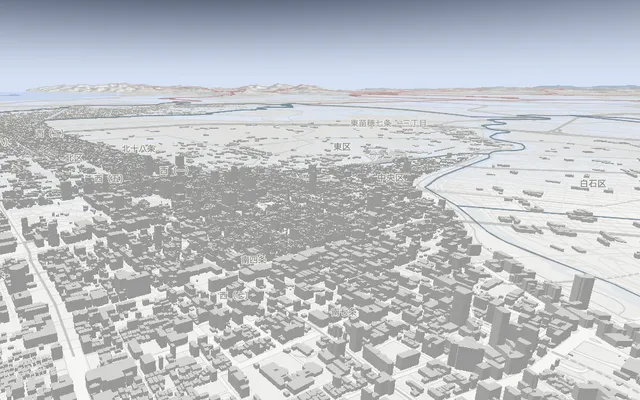 A citizen-first digital twin of Sapporo on the same core as Yokohama and Kyoto: tap your home for nearest stations, flood and landslide risk and evacuation sites on one card. Odori Park, a history tour from 1869 and PLATEAU 3D buildings, in 26 languages.Satellite data (COG)26 languages
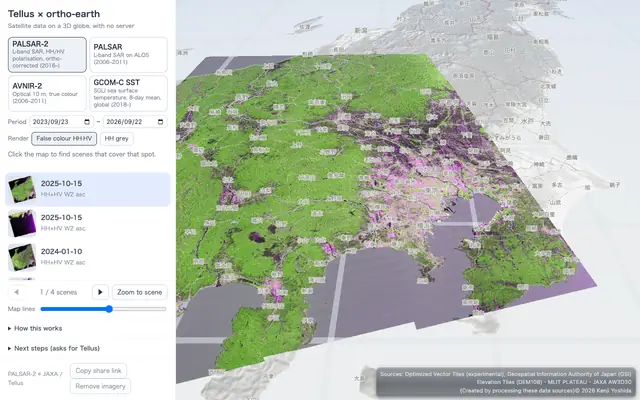 Satellite images (COG) on a server (Tellus), laid over the globe in 3D.ortho-japan26 languages
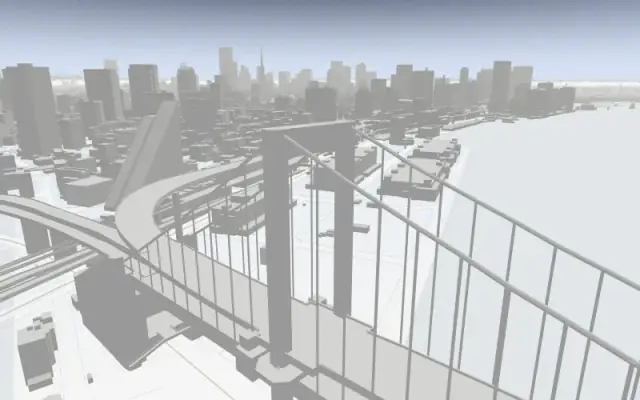 A map drawn only from Japan's public data. Try out the basic features.National Parks of Japan26 languages
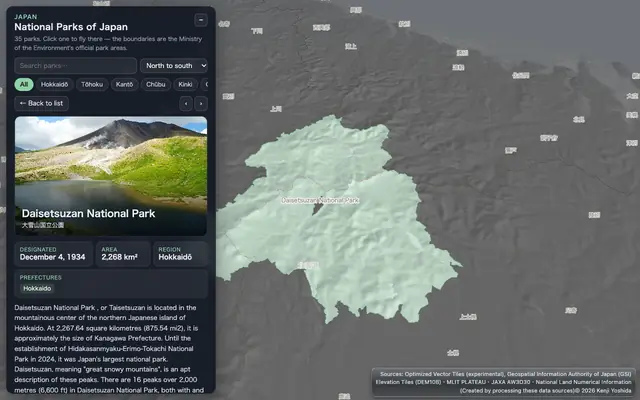 All 35 national parks of Japan on a 3D globe — photos, the official boundaries, facts and Wikipedia links.Hot springs of Japan26 languages
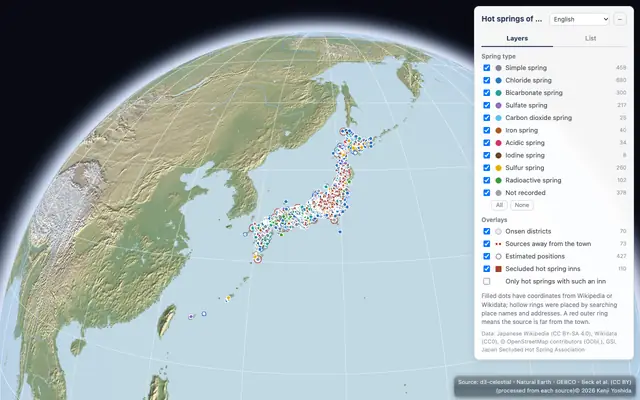 About 2,000 hot springs of Japan from Wikipedia on a 3D map, colored by spring type, with onsen districts, distant sources and member inns of the Japan Secluded Hot Spring Association.Landforms of Japan26 languages
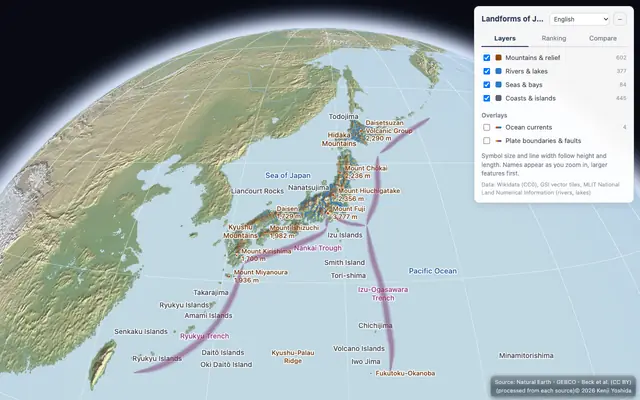 Mountains, volcanoes, rivers, lakes, plains, islands and seas of Japan on a 3D map, with their heights, lengths, areas and depths side by side.GLB models26 languages
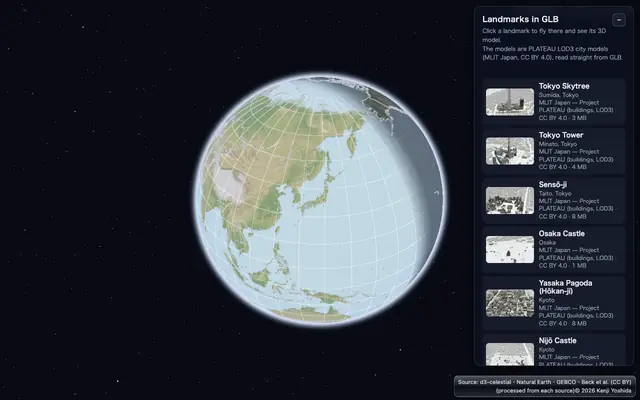 Landmarks such as Tokyo Tower, placed on the globe as GLB models. Download them in a range of 3D formats.Fireworks over Sumida26 languages
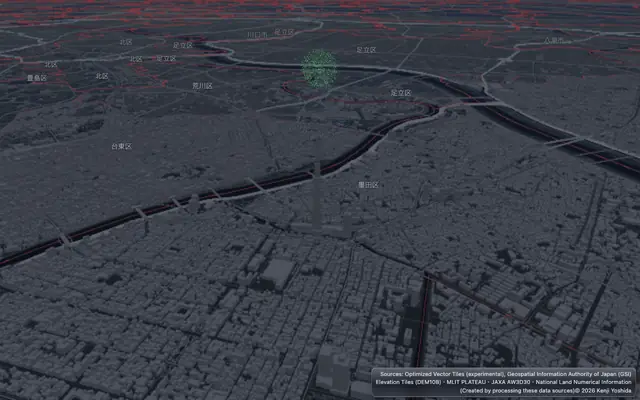 Full-scale fireworks (a 10-inch shell opens 320 m wide at 330 m) launched over the Sumida River, hidden by the buildings and Tokyo Skytree in front of them.Statistics in 3D26 languages
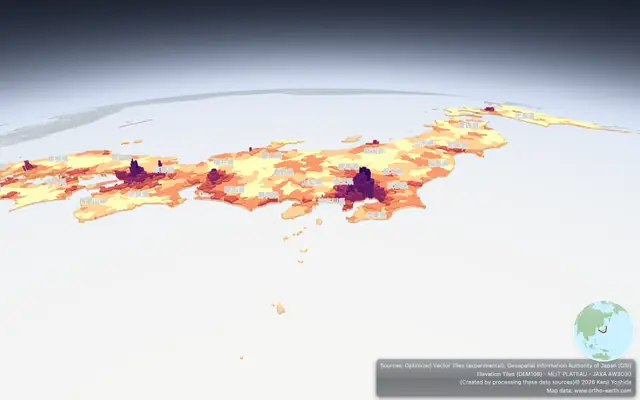 A 3D graph from the 2020 census — every municipality raised by its population density.An old map of Edo26 languages
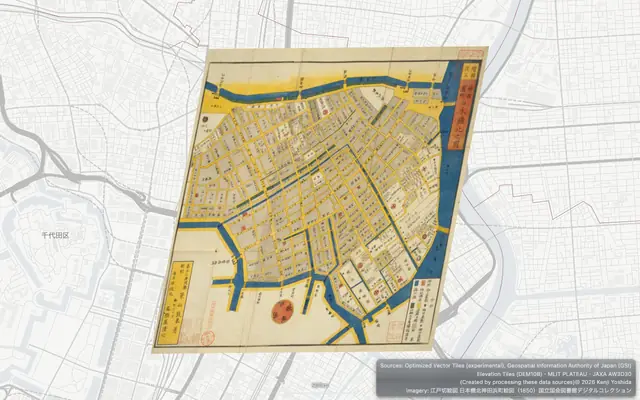 A woodblock map of Nihonbashi from 1850, read as IIIF tiles straight from the National Diet Library and laid on today's Tokyo by its control points.ortho-nl26 languages
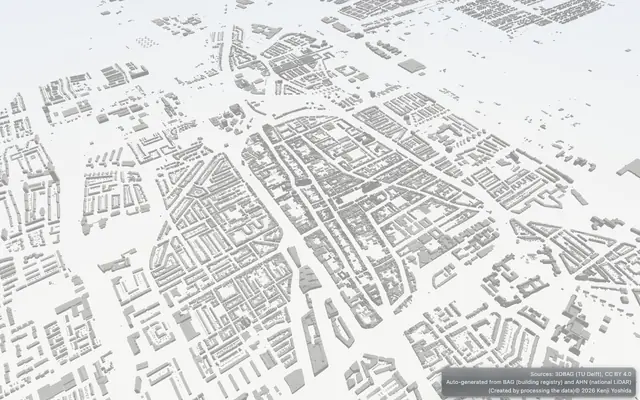 The Netherlands in 3D — PDOK 3D Basisvoorziening buildings standing on OpenStreetMap vector tiles and terrain. Hop between eight cities, from Delft to Maastricht.
Free to use in education, always. Ready to use as is in classrooms around the world.
Look first, then build — with code or with an AI agent. Every step here is run by an automated test against the published npm packages.
The globe keeps getting faster and its API stays consistent: every change passes the same automated checks before it ships, so what you learn here keeps working.
From a quick public URL embedded with an iframe to an elaborate app with your own shaders, the same globe serves a wide range of uses.
Open any demo — nothing to install. Drop your own GIS file onto the globe; it is read in your browser and never uploaded.
ortho-japan GeoPBFVite and npm — the whole world first, then your own data on top. The API is MapLibre GL JS, so if you know MapLibre there is nothing new to learn.
npm create vite@latest my-globe -- --template vanilla --no-interactive
cd my-globe
npm install
npm install @ortho-earth/globeexport default {
optimizeDeps: { exclude: ["@ortho-earth/globe", "@ortho-earth/core"] },
worker: { format: "es" },
};<!doctype html>
<html>
<head>
<meta charset="utf-8">
<meta name="viewport" content="width=device-width, initial-scale=1">
<title>My globe</title>
<link rel="icon" href="data:,">
<style>html, body { margin: 0; height: 100%; } #map { height: 100vh; }</style>
</head>
<body>
<div id="map"></div>
<script type="module" src="/src/main.js"></script>
</body>
</html>import { createGlobe } from "@ortho-earth/globe";
const map = await createGlobe({ target: "#map", view: "#3/20/140" }); // "#zoom/lat/lon"npm run devmap.addSource("cities", {
type: "geojson",
data: {
type: "FeatureCollection",
features: [
{ type: "Feature", properties: { name: "Tokyo" }, geometry: { type: "Point", coordinates: [139.77, 35.68] } },
{ type: "Feature", properties: { name: "Seoul" }, geometry: { type: "Point", coordinates: [126.98, 37.57] } },
],
},
});
await map.addLayer({ id: "cities", type: "circle", source: "cities",
paint: { "circle-radius": 6, "circle-color": "#e4572e" } });import * as maplibregl from "@ortho-earth/globe/maplibre";
const map = new maplibregl.Map({
container: "map",
style: "https://demotiles.maplibre.org/style.json",
center: [139.77, 35.68],
zoom: 4,
});No bundler? Copy the prebuilt SDK into your site — it is in the full recipe.
Full recipe 139 MapLibre examples Docs npmClaude Code, Cursor, Codex … Connect the Ortho Earth MCP server once, then just say what you want.
claude mcp add --transport http ortho-earth https://www.ortho-earth.com/mcpUse the ortho-earth MCP server and check the recipe (get_started) first.
Make me a web page with a 3D globe that shows the 10 most populous
cities of the world as red dots. When I click a dot, show the city's
name and population. Start the view looking at Asia.No MCP? Start the request with "Read https://www.ortho-earth.com/llms.txt" and it works the same way.
The recipe the MCP server hands out is checked on every release by an automated test against the published npm packages.
Make the map in geoedit — draw shapes, pins and labels right on the globe and save them as a GeoPBF file. No GIS software needed.
Put a GeoPBF file in your own GitHub repository and open it by its address. Your map stays yours; list it in Maps so others can find it.
https://www.ortho-earth.com/japan/?g=gh:you/repo/map.geopbfSince 2.0 the libraries are written in TypeScript (strict), and their types ship in each package. Upgrading from 1.x
2018 年の iPhone XS と普及帯の Android タブレットで、PLATEAU の千代田区を MapLibre・Cesium・Navara・ortho-earth の最新版で測りました。Navara はどの計り方でも崩れず、普及機でも 60 fps で回せるエンジンが複数ありました。
初めての Android タブレットがやって来た。その日のうちに Android も WebGPU で動くようになり、6 日間で京都の滑走は 36%、丸の内の建物は 25〜30% 速くなった。Unity・Unreal・Minecraft とも行き来でき、Cesium の同じ絵は 226 → 234 本に。
A first Android tablet arrived. The same day Android started on WebGPU, and in six days the Kyoto glide got 36% faster and the Marunouchi buildings 25–30%. Round trips with Unity, Unreal and Minecraft, and Cesium's same picture 226 → 234.
どちらにも無い描画(画面の映り込みなど 6 つ)を足し、その上で Cesium(同じ絵 190 → 226 本)と MapLibre(一部しか動かない例 12 → 3 本)へのフォローも続けた。
Rendering that neither has (screen-space reflections and five more), and on top of that keeping up with Cesium (same picture 190 → 226) and MapLibre (examples that only partly run 12 → 3).
Cesium にできて ortho-earth にできないものを、Sandcastle 309 本をなぞりながら一つずつ消していった 7 日間の記録。同じ絵は 23 本から 190 本に、動かない例は 0 本になった。
Seven days of tracing Cesium's 309 Sandcastle examples and crossing off, one by one, what Cesium could do and ortho-earth could not. Same picture went from 23 to 190; examples that do not run went to 0.
CesiumJS の Sandcastle 297 本がすべてコードを変えずに地球儀で動き、190 本は同じ絵に。@ortho-earth/cesium と、Leaflet・Google Maps のコード向けのパッケージも出しました。
All 297 graded CesiumJS Sandcastle examples run unchanged on the globe, 190 with the same picture. New packages for Cesium, Leaflet and Google Maps code.
地図の文字を WebGPU に移し、MapLibre の公式例で同じ絵が 66 本から 79 本に。使い方は 2.0 のまま、下がった例は 0 本。大きく変えても壊れない版です。
Map text moved to WebGPU, and the MapLibre official examples drawing the same picture went from 66 to 79. Same API as 2.0, zero regressions: a big change that broke nothing.
2026 年 4 月の最初の一行から半年。Gint、PLATEAU、WebGPU、26 言語、MapLibre 互換を経て、TypeScript で書き直した第 2 版を出すまでの話。
Six months from the first line in April 2026. Gint, PLATEAU, WebGPU, 26 languages and MapLibre compatibility, and then a second edition rewritten in TypeScript.
描画性能の比較の対になる話です。同じ「地図エンジン」でも、2D の地図、3D の地球、完成品のアプリ、写実的な絵作り、球の地球儀と、出発点がそれぞれ違いました。
The companion to the rendering benchmark. They are all called map engines, but they start from different places: a 2D map, a 3D Earth, a finished app, photorealistic rendering, and an always-round globe.
PLATEAU の千代田区の建物を、5 つの Web 3D 地図エンジンで同じ条件で描き、Mac 2 台と iPhone で測りました。速さの差より、どこで手を抜くかに設計が出ました。
I drew the PLATEAU buildings of Chiyoda, Tokyo with five web 3D map engines under the same conditions and measured them on two Macs and an iPhone. The design showed less in the speed than in where each engine cuts corners.
見た目はほとんど変えず、TypeScript で建て直して古い呼び名を捨てた版。出したあと、他のエンジンと並べて測って見つかったことも。
Rebuilt in TypeScript with the old aliases dropped, while the globe looks the same. Plus what turned up after release, measuring it side by side with other engines.
横浜の退職エンジニアが、誰にも頼まれず独りで、地図を丸い地球に描き直している。その始まりと、AI の製図係との協業の話。
A retired engineer in Yokohama, asked by no one, redrawing the map on a round Earth alone. How it began, and working with an AI draughtsman. In Japanese.